For BU & Brand Performance
From Patient Signals to Stronger Brand Performance.
PACE gives Brand teams the independent intelligence layer to see growth opportunity and persistence risk earlier, understand patient dynamics, prioritise where to focus, verify PSP impact and protect treatment continuity, turning patient insights into stronger brand performance and therapy value.

See growth & value risk earlier
Identify emerging growth opportunity and persistence risk before it becomes patient loss.
Focus on the right opportunities
Prioritise indications, accounts, regions and patient segments with the highest potential impact.
Understand patient dynamics
See new starts, switch-in, continuing/established and re-engaged patients alongside treatment continuity.
Verify PSP impact
Track intervention follow-through and documented outcomes on persistence and continuity.
Protect therapy value
Reduce avoidable leakage and strengthen patient-based planning and forecast confidence.
Current challenge
Persistence risk appears too late
Sales and retrospective reports often show impact after patients have already delayed, extended intervals or discontinued.
Limited live-time visibility
Unclear which patients are on track, drifting or at risk across accounts and regions.
Unclear patient dynamics
Difficult to distinguish treatment-naive/new-start, switch-in, continuing/established and re-engaged cohorts.
Patient-flow leakage
Drop-offs can occur between enrolment, initiation, ongoing treatment and continuity.
Unclear PSP contribution
Difficult to connect support activity to measurable patient continuity and programme outcomes.
Disconnected data sources
Programme, PSP and commercial planning data are often reviewed separately.
Forecast assumptions lag reality
Patient mix, persistence and treatment-rhythm changes may not be reflected quickly enough.
Brand intelligence modules
Patient mix
Treatment-naive/new-start, switch-in, continuing/established and re-engaged/restarted, with cohort rules defined per programme.
Persistence-risk early warning
On rhythm, monitor, emerging risk and high risk, based on documented treatment-rhythm signals. Not a clinical diagnosis.
Patient-flow & leakage
Enrolment → initiation → active treatment → at-risk → interruption/discontinuation, using the population actually covered by the PSP.
Account / region performance
Programme patient distribution, persistence risk, continuity and growth trends by permitted hospital/account grouping and region.
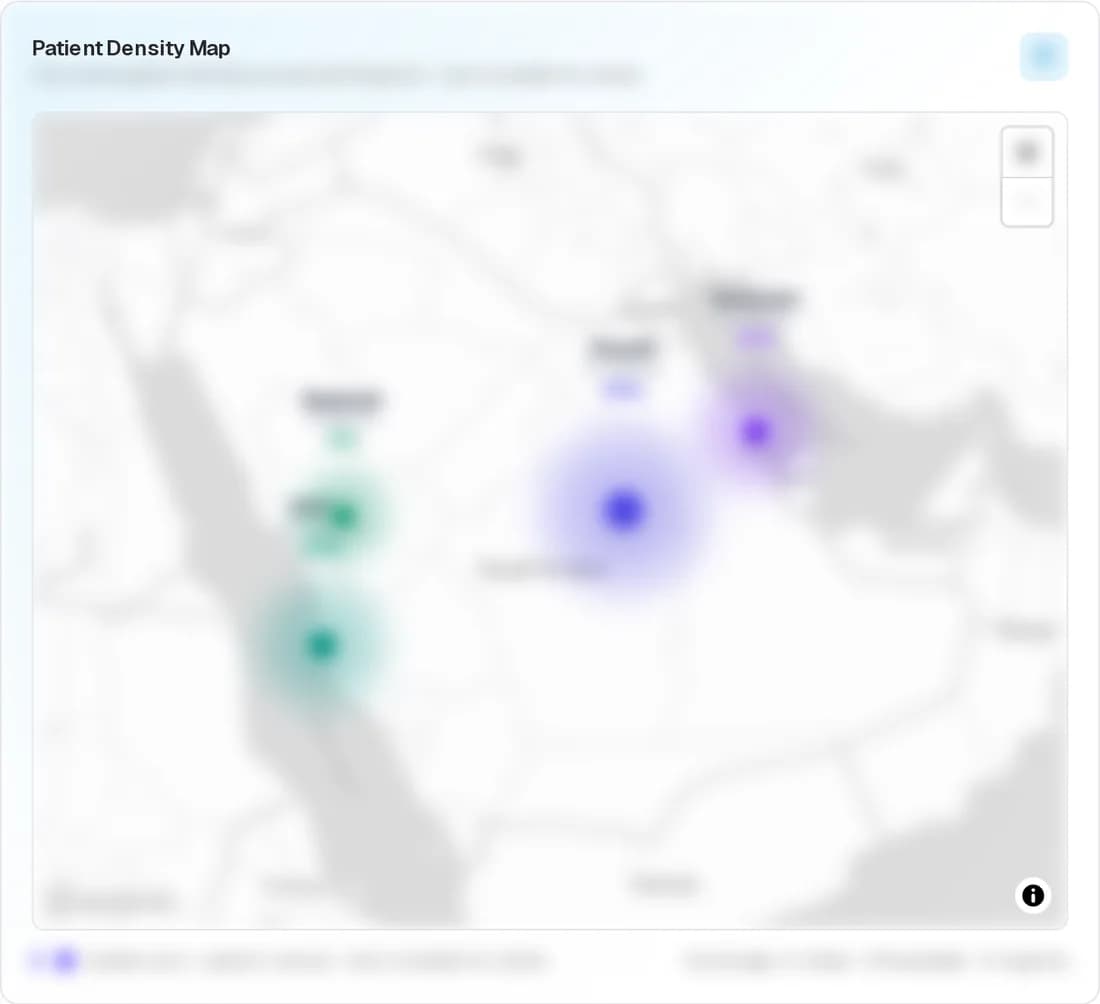
Saudi heatmap
Patient concentration, growth momentum, persistence risk and opportunity, using accurate geography and aggregate data.
Forecast inputs
Use enrolment, active-treatment trend, cohort mix, persistence and recorded intervals to inform planning assumptions.
Estimated therapy value at risk
A clearly labelled scenario estimate using approved methodology. Explore your own assumptions in the value assessment.
PSP contribution
Intervention completion, resolution and subsequent treatment status, without automatically attributing every retained patient to an intervention.
Brand decision areas
- Growth and persistence
- Emerging risk and therapy value at risk
- Account/region/indication prioritisation
- Patient mix
- Intervention impact
- Forecast confidence
- Portfolio comparison
Executive outcomes
- Earlier growth and risk signals
- Lower avoidable patient leakage
- Sharper account and indication prioritisation
- Better patient-based forecast confidence
- Clearer PSP contribution
- Stronger retained therapy value
Bring one programme challenge. See how PACE addresses it.
Explore patient mix, persistence risk, account and region intelligence and forecast inputs for one brand programme.
Pilot proof-of-value measures
- Time from risk signal to action
- Overdue follow-ups
- Ageing unresolved cases
- Documented resolution
- Persistence / discontinuation
- Handover completeness